EMS Resource Planning & Scheduling
Optimizing EMS Shift Scheduling with Excel Solver and UHU Analysis
Scheduling EMS resources efficiently is one of the most underappreciated analytical challenges in the industry. Too few units on the road and you miss response time benchmarks. Too many and labor costs escalate unnecessarily. Most operations set their schedules based on historical instinct and adjust reactively. This post outlines a more structured, data-driven approach — one that uses historical unit hour utilization (UHU) data and Excel’s Solver capability to generate optimized shift schedules within the operational constraints that actually govern your environment.
Why This Problem Is Harder Than It Looks
Creating an EMS schedule is not simply a matter of covering peak hours with more units. Several interacting factors must be accounted for simultaneously:
- Demand varies by day of week, time of day, level of service, and geography.
- Shift length options are typically constrained (not every starting hour supports every shift length).
- Operational policies may prohibit shift starts during certain overnight hours.
- Each shift has effective coverage that differs from its nominal length — a 10-hour shift does not deliver 10 hours of productive unit time once weather checks and return-to-base periods are factored in.
- UHU targets (80th percentile, 90th percentile, etc.) vary by organization and contract.
Managing all of these variables manually — across seven days and 24 starting hours — quickly becomes intractable. That is the problem the Solver-based approach is designed to solve.
Phase 1: Data Extraction and Preparation
Before any schedule can be optimized, the demand data it is based on must be accurate and appropriately scoped. Several decisions need to be made at this stage:
What trips to include
The most fundamental question is whether the analysis should use transports only (UHU-T) or responses as well (UHU-R). These produce meaningfully different results, and the answer depends on what your contracts and reporting benchmarks are based on. Some operations also need to segregate the data by level of service (ALS, BLS, Critical Care) or coverage zone before running the analysis — a single aggregate number will produce a schedule that averages across very different demand profiles.
Handling lost calls
Cancellations due to poor ETA — calls that were dispatched but lost before a unit arrived — do not capture actual on-trip time (TOT). However, they represent real demand that your schedule should have been able to cover. Including these as if they had been serviced produces a more honest picture of total demand and prevents the analysis from understating the true resource requirement.
The elapsed time a unit is committed to a call, from assignment through clear. TOT is the primary input to UHU calculations. An accurate TOT report, scoped to the right trip universe, is the foundation of reliable schedule modeling.
Once the data scope is finalized, the TOT report needs to be adjusted to reflect it — including any segregation logic, lost call handling, and UHU percentile targets. This produces the base demand numbers the Solver will optimize against.
Phase 2: Defining Operational Constraints
The Solver can only produce a realistic schedule if it knows what constraints to operate within. Before building the template, the following questions need clear answers:
- Shift lengths: What lengths are currently in use or allowed? Are there minimums or maximums on how many of a given shift type can exist per day?
- Prohibited start hours: Are there times when no shift should begin? In one operating environment, no shifts start between 1:00 AM and 4:00 AM — those hours are essentially unworkable from a coverage standpoint and are excluded from the template entirely.
- Effective coverage ratios: Each shift does not deliver its full nominal hours. A 15-minute weather check at shift start and a 30-minute return-to-base window at shift end reduce a 10-hour shift’s effective coverage to roughly 9.25 hours. These ratios need to be built into the model explicitly, or the Solver will overpromise coverage.
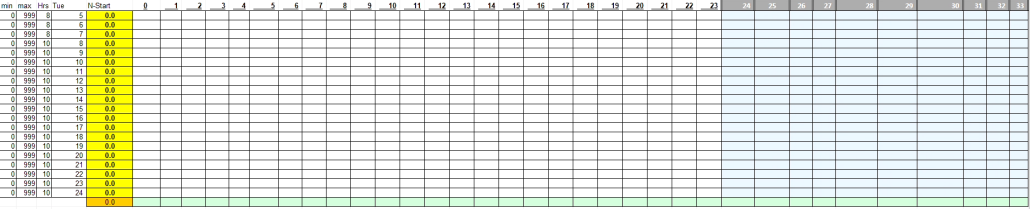
Phase 3: Building the Solver Template
The optimization template is structured as a grid — one for each day of the week, covering all 24 possible starting hours. Each grid contains the following fields:
Min
The minimum number of shifts that must start in this hour slot (if any constraint applies).
Max
The maximum number of shifts allowed to start in this hour slot.
Hrs
The allowed shift length for this starting hour. Different start times may allow different shift lengths.
N-Start
The variable the Solver calculates — the optimal number of shifts to begin at this hour on this day.
The Solver add-in (or the free and more capable OpenSolver add-in available at opensolver.org) is configured with the N-Start column as the variable to optimize. Constraints enforce that the resulting coverage never falls below the UHU target for any hour, and that shift count minimums and maximums are respected.
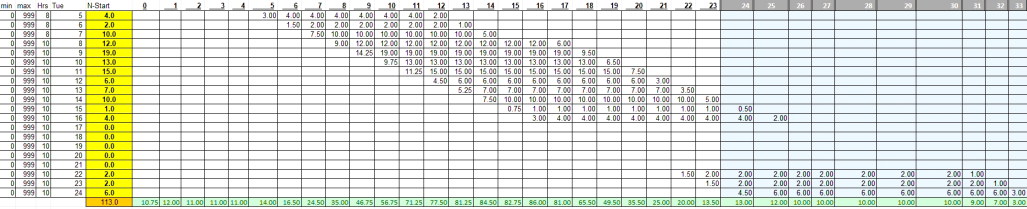
Phase 4: Running the Solver and Reading the Output
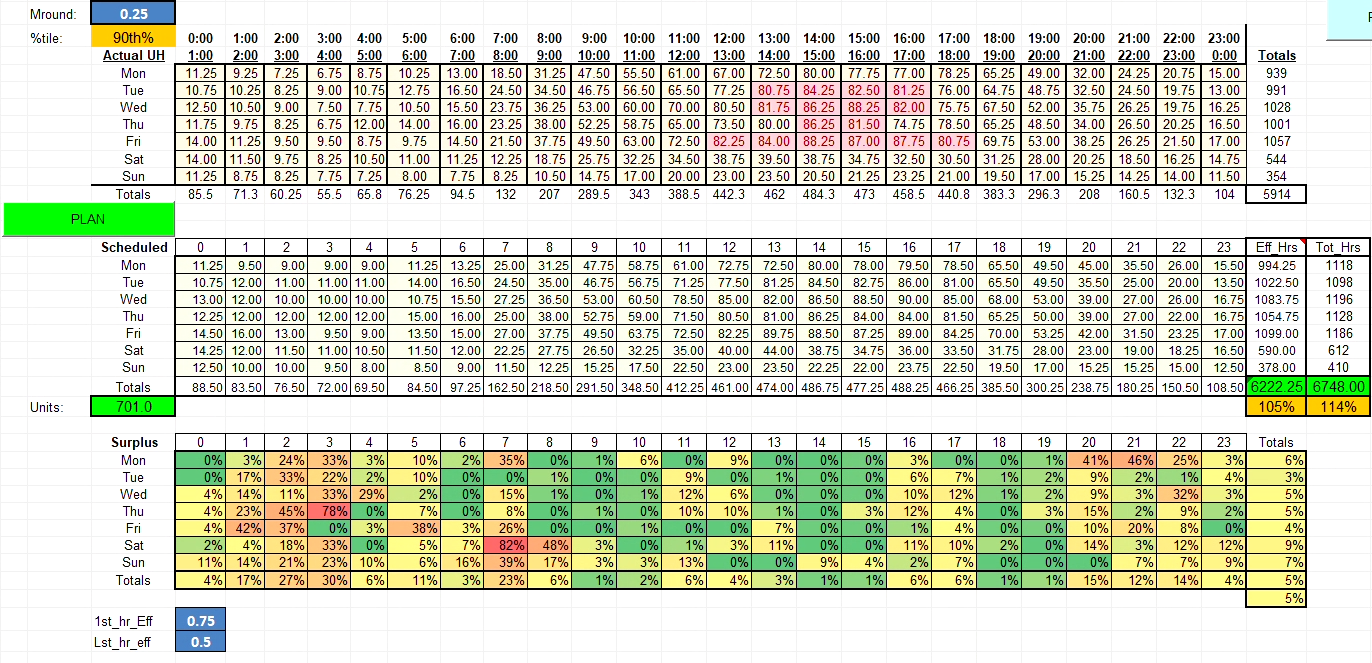
Once the template is configured, running the Solver produces a suggested schedule — the minimum number of shift starts per hour needed to meet the target UHU. The output is organized into three sections:
- Top grid: The target coverage level, at the chosen percentile (e.g., 90th), adjusted for effective coverage ratios. A rounding step ensures no fractional unit is scheduled below a minimum threshold (0.25 in this implementation).
- Middle grid: The suggested schedule — how many shifts to start at each hour on each day.
- Bottom grid: Surplus units per hour, showing where the schedule exceeds the target and by how much.
What This Process Produces
The output of this process is not a final schedule — it is an optimized starting point. The Solver tells you the minimum number of unit hours needed by starting hour to meet your UHU target. Translating that into an actual posted schedule still requires layering in crew availability, labor agreement rules, seniority considerations, and operational judgment.
What it eliminates is the guesswork in the baseline. Instead of building a schedule from intuition and adjusting reactively when benchmarks are missed, the analysis gives a data-grounded answer to: how many units, starting when, on which days?
Running this process for all seven days of the week, at two or three percentile levels, takes less time than most operations spend manually tweaking a schedule after the fact. And because it is built on your own historical TOT data, it reflects your actual demand patterns — not industry averages or generic templates.
Want to Apply This to Your Scheduling Process?
DataAuthenticity LLC builds custom scheduling analysis models, UHU reporting frameworks, and operational efficiency tools for EMS agencies and ambulance services. If your current schedule was built on intuition rather than data, there is likely room to optimize.
Start a Conversation